Much has been written about how to properly conduct in-person or remote usability testing sessions to get helpful and unbiased feedback from participants. That feedback is only useful to your team if you can transform it into actionable insights in a meaningful report to your stakeholders.
As a visual learner, I’ve used sticky notes and whiteboards as my go-to analysis tool for many years. Recently, I’ve become more accustomed to virtual whiteboards, which are easier to share, collaborate and use remotely. My preferred tool is Mural (www.mural.co), but there are many out there.
I’d like to share some of the analysis tips and tricks I use with Interactux that I’ve gained over the many tests I’ve run over the last 10 years.
Setting Yourself Up For Success
Ensuring you have good results to analyze means ensuring your task-based study is set up to support your analysis ahead of time. That means:
- Participant Audio/Video Recordings: Essential, even with good note taking. One convincing video of a user struggling with an interface says it all.
- Detailed Notes and Flags: Having a notetaker take detailed notes throughout the study, matched with timecodes, will save you an enormous amount of time during analysis. If you or your notetaker can flag key areas of interest during the study, you’ll save time searching later.
- Quantitative Data: While most moderated testing is qualitative, there are some quantitive data points you can collect along the way. That includes, Pass/Fail for each task, scaled ratings in the areas of Navigation, Content and Design and time spent per task.
Spelunking for Interesting Findings
After your study is complete, it’s time to start digging into each session and documenting interesting findings and notes of interest.
This should be a systematic and organized process, rather a giant list of disparate findings.
Here’s what I recommend:
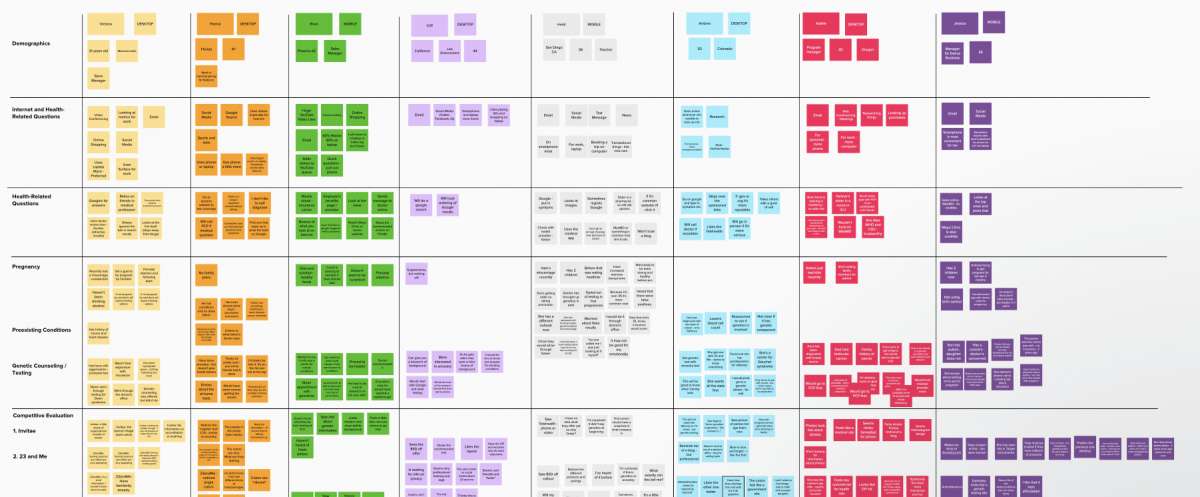
- Create a Grid: Create a grid using a spreadsheet, whiteboard or online whiteboard that lists each participant in a row and each task in a column.
- Add Notes of Interest: As you review your recordings and notes, add a spreadsheet entry or sticky note for every interesting finding in the appropriate spot that corresponds to the participant and task.
- Color Code Your Notes If using sticky notes (virtual or physical), use a distinct color for each participant. This will allow you to tie a finding back to a participant later.
- Mark Videos and Quotes Create special notes for interesting quotes or video time codes. You’ll include these as visual aides and proof points later in your report.
- Start Identifying Trends: If you come across something you’ve seen before, mark that note with a highlight, bold text or sticker. That will help you pick those trends out easier later on.
Playing the Match Game
Now you have an organized list of interesting findings organized by task and by participant. It’s time to blow up your board and start grouping items into themes.
This is a great group/team activity. You’ve already picked out major findings, but your team can help turn them into meaningful themes through collaborative conversation and understanding.
Pulling It Together
I hope you’ve found these tips helpful and can put them to use on your next project. If you, your company or creative agency find yourselves needing extra UX consulting help, feel free to contact me at Interactux

